
各种股票收益率(returns)的计算方法
Contents
各种股票收益率(returns)的计算方法#
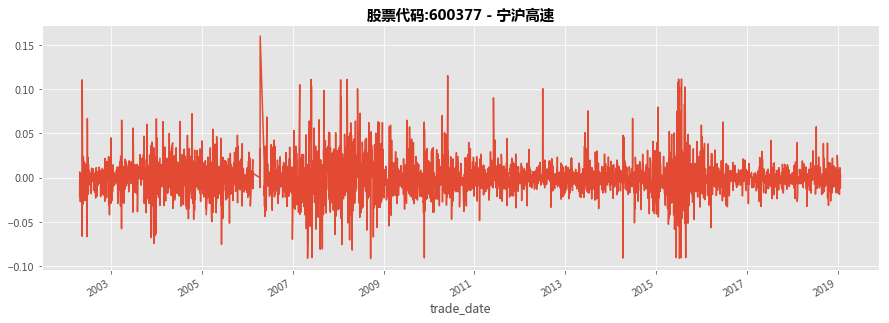
Fig. 16 股票收益率#
前言
我们一般对股票的理解一般只停留于各大交易软件如东方财富、通达信等所提供的基本信息。 股票的日线图除了告诉我们股价的走势之外,股民基本上将其用于MACD、KDJ等技术分析上。 事实上, 我们可以利用股票的历史价格可以算出股票的走势是否正态分布、 回报率(Returns)、波动率(Volatility)、偏度(skewness) 和 峰度(kurtosis)。
本文将介绍收益率的计算方法。
实现过程#
import tushare as ts
import pandas as pd
import numpy as np
import scipy.stats
import matplotlib.pyplot as plt
plt.style.use('seaborn-white')
plt.rcParams['font.sans-serif'] = ['SimHei']
plt.rcParams['axes.unicode_minus'] = False

pro = ts.pro_api('xxxxxxxxxxxxxxxxxxxxxxxxxxxxxxxxxxxxxxxxxxxxxxxxx') #这里需要填写你注册好的Tushare的TOKEN凭证
/tmp/ipykernel_2269/2253130725.py:6: MatplotlibDeprecationWarning: The seaborn styles shipped by Matplotlib are deprecated since 3.6, as they no longer correspond to the styles shipped by seaborn. However, they will remain available as 'seaborn-v0_8-<style>'. Alternatively, directly use the seaborn API instead.
  plt.style.use('seaborn-white')
通过调用tushare获取股票600377(宁沪高速)的股票数据,这里不设置日期,那么默认获取Tushare提供的历史数据。
ticker_data = pro.daily(ts_code='600377.SH')
print('数据数目:',len(ticker_data))
ticker_data.head(5)
数据数目: 5278
| ts_code | trade_date | open | high | low | close | pre_close | change | pct_chg | vol | amount | |
|---|---|---|---|---|---|---|---|---|---|---|---|
| 0 | 600377.SH | 20230216 | 8.10 | 8.15 | 8.05 | 8.07 | 8.11 | -0.04 | -0.4932 | 40840.64 | 33117.312 |
| 1 | 600377.SH | 20230215 | 8.14 | 8.15 | 8.09 | 8.11 | 8.13 | -0.02 | -0.2460 | 31751.18 | 25757.239 |
| 2 | 600377.SH | 20230214 | 8.17 | 8.18 | 8.12 | 8.13 | 8.14 | -0.01 | -0.1229 | 45641.97 | 37190.139 |
| 3 | 600377.SH | 20230213 | 8.18 | 8.20 | 8.10 | 8.14 | 8.17 | -0.03 | -0.3672 | 61499.73 | 50133.679 |
| 4 | 600377.SH | 20230210 | 8.20 | 8.21 | 8.15 | 8.17 | 8.22 | -0.05 | -0.6083 | 36648.00 | 29940.740 |
从上面可以看出,序号并不是以时间作为单位的。那么我们首先需要将trade_date转为datetime格式,然后设置为序号以便于画图。
ticker_data['trade_date'] = pd.to_datetime(ticker_data['trade_date'],format='%Y%m%d')
ticker_data.set_index('trade_date', inplace=True)
returns = ticker_data["close"].pct_change().dropna()
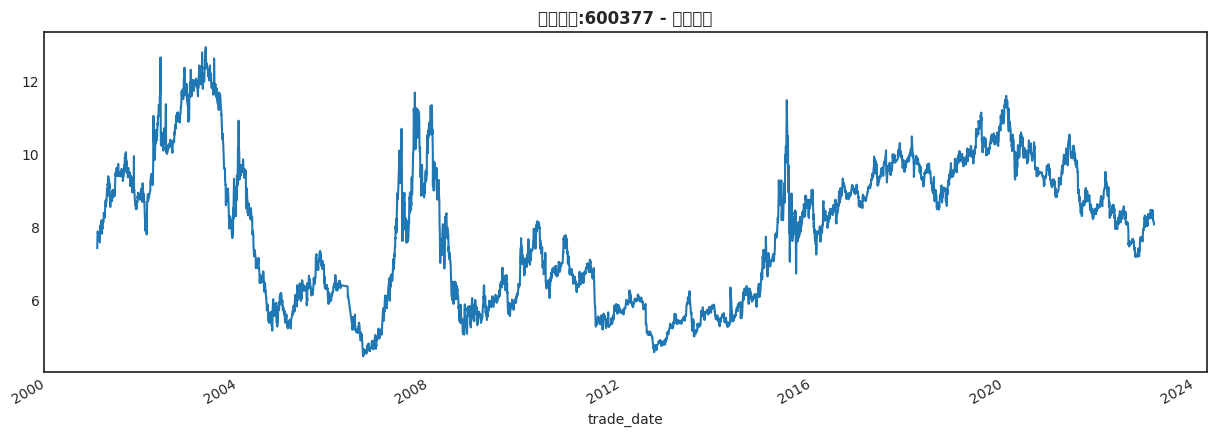
plt.figure(figsize=(15, 5))
plt.title("股票代码:600377 - 宁沪高速", weight='bold')
ticker_data['close'].plot()
<Axes: title={'center': '股票代码:600377 - 宁沪高速'}, xlabel='trade_date'>
/opt/hostedtoolcache/Python/3.8.16/x64/lib/python3.8/site-packages/IPython/core/events.py:89: UserWarning: Glyph 32929 (\N{CJK UNIFIED IDEOGRAPH-80A1}) missing from current font.
  func(*args, **kwargs)
/opt/hostedtoolcache/Python/3.8.16/x64/lib/python3.8/site-packages/IPython/core/events.py:89: UserWarning: Glyph 31080 (\N{CJK UNIFIED IDEOGRAPH-7968}) missing from current font.
  func(*args, **kwargs)
/opt/hostedtoolcache/Python/3.8.16/x64/lib/python3.8/site-packages/IPython/core/events.py:89: UserWarning: Glyph 20195 (\N{CJK UNIFIED IDEOGRAPH-4EE3}) missing from current font.
  func(*args, **kwargs)
/opt/hostedtoolcache/Python/3.8.16/x64/lib/python3.8/site-packages/IPython/core/events.py:89: UserWarning: Glyph 30721 (\N{CJK UNIFIED IDEOGRAPH-7801}) missing from current font.
  func(*args, **kwargs)
/opt/hostedtoolcache/Python/3.8.16/x64/lib/python3.8/site-packages/IPython/core/events.py:89: UserWarning: Glyph 23425 (\N{CJK UNIFIED IDEOGRAPH-5B81}) missing from current font.
  func(*args, **kwargs)
/opt/hostedtoolcache/Python/3.8.16/x64/lib/python3.8/site-packages/IPython/core/events.py:89: UserWarning: Glyph 27818 (\N{CJK UNIFIED IDEOGRAPH-6CAA}) missing from current font.
  func(*args, **kwargs)
/opt/hostedtoolcache/Python/3.8.16/x64/lib/python3.8/site-packages/IPython/core/events.py:89: UserWarning: Glyph 39640 (\N{CJK UNIFIED IDEOGRAPH-9AD8}) missing from current font.
  func(*args, **kwargs)
/opt/hostedtoolcache/Python/3.8.16/x64/lib/python3.8/site-packages/IPython/core/events.py:89: UserWarning: Glyph 36895 (\N{CJK UNIFIED IDEOGRAPH-901F}) missing from current font.
  func(*args, **kwargs)
/opt/hostedtoolcache/Python/3.8.16/x64/lib/python3.8/site-packages/IPython/core/pylabtools.py:152: UserWarning: Glyph 32929 (\N{CJK UNIFIED IDEOGRAPH-80A1}) missing from current font.
  fig.canvas.print_figure(bytes_io, **kw)
/opt/hostedtoolcache/Python/3.8.16/x64/lib/python3.8/site-packages/IPython/core/pylabtools.py:152: UserWarning: Glyph 31080 (\N{CJK UNIFIED IDEOGRAPH-7968}) missing from current font.
  fig.canvas.print_figure(bytes_io, **kw)
/opt/hostedtoolcache/Python/3.8.16/x64/lib/python3.8/site-packages/IPython/core/pylabtools.py:152: UserWarning: Glyph 20195 (\N{CJK UNIFIED IDEOGRAPH-4EE3}) missing from current font.
  fig.canvas.print_figure(bytes_io, **kw)
/opt/hostedtoolcache/Python/3.8.16/x64/lib/python3.8/site-packages/IPython/core/pylabtools.py:152: UserWarning: Glyph 30721 (\N{CJK UNIFIED IDEOGRAPH-7801}) missing from current font.
  fig.canvas.print_figure(bytes_io, **kw)
/opt/hostedtoolcache/Python/3.8.16/x64/lib/python3.8/site-packages/IPython/core/pylabtools.py:152: UserWarning: Glyph 23425 (\N{CJK UNIFIED IDEOGRAPH-5B81}) missing from current font.
  fig.canvas.print_figure(bytes_io, **kw)
/opt/hostedtoolcache/Python/3.8.16/x64/lib/python3.8/site-packages/IPython/core/pylabtools.py:152: UserWarning: Glyph 27818 (\N{CJK UNIFIED IDEOGRAPH-6CAA}) missing from current font.
  fig.canvas.print_figure(bytes_io, **kw)
/opt/hostedtoolcache/Python/3.8.16/x64/lib/python3.8/site-packages/IPython/core/pylabtools.py:152: UserWarning: Glyph 39640 (\N{CJK UNIFIED IDEOGRAPH-9AD8}) missing from current font.
  fig.canvas.print_figure(bytes_io, **kw)
/opt/hostedtoolcache/Python/3.8.16/x64/lib/python3.8/site-packages/IPython/core/pylabtools.py:152: UserWarning: Glyph 36895 (\N{CJK UNIFIED IDEOGRAPH-901F}) missing from current font.
  fig.canvas.print_figure(bytes_io, **kw)
下面将画出每日收盘价的百分比变化图:
plt.figure(figsize=(15, 5))
ticker_data["close"].pct_change().plot()
plt.title("股票代码:600377 - 宁沪高速", weight='bold');
/opt/hostedtoolcache/Python/3.8.16/x64/lib/python3.8/site-packages/IPython/core/events.py:89: UserWarning: Glyph 32929 (\N{CJK UNIFIED IDEOGRAPH-80A1}) missing from current font.
  func(*args, **kwargs)
/opt/hostedtoolcache/Python/3.8.16/x64/lib/python3.8/site-packages/IPython/core/events.py:89: UserWarning: Glyph 31080 (\N{CJK UNIFIED IDEOGRAPH-7968}) missing from current font.
  func(*args, **kwargs)
/opt/hostedtoolcache/Python/3.8.16/x64/lib/python3.8/site-packages/IPython/core/events.py:89: UserWarning: Glyph 20195 (\N{CJK UNIFIED IDEOGRAPH-4EE3}) missing from current font.
  func(*args, **kwargs)
/opt/hostedtoolcache/Python/3.8.16/x64/lib/python3.8/site-packages/IPython/core/events.py:89: UserWarning: Glyph 30721 (\N{CJK UNIFIED IDEOGRAPH-7801}) missing from current font.
  func(*args, **kwargs)
/opt/hostedtoolcache/Python/3.8.16/x64/lib/python3.8/site-packages/IPython/core/events.py:89: UserWarning: Glyph 23425 (\N{CJK UNIFIED IDEOGRAPH-5B81}) missing from current font.
  func(*args, **kwargs)
/opt/hostedtoolcache/Python/3.8.16/x64/lib/python3.8/site-packages/IPython/core/events.py:89: UserWarning: Glyph 27818 (\N{CJK UNIFIED IDEOGRAPH-6CAA}) missing from current font.
  func(*args, **kwargs)
/opt/hostedtoolcache/Python/3.8.16/x64/lib/python3.8/site-packages/IPython/core/events.py:89: UserWarning: Glyph 39640 (\N{CJK UNIFIED IDEOGRAPH-9AD8}) missing from current font.
  func(*args, **kwargs)
/opt/hostedtoolcache/Python/3.8.16/x64/lib/python3.8/site-packages/IPython/core/events.py:89: UserWarning: Glyph 36895 (\N{CJK UNIFIED IDEOGRAPH-901F}) missing from current font.
  func(*args, **kwargs)
/opt/hostedtoolcache/Python/3.8.16/x64/lib/python3.8/site-packages/IPython/core/pylabtools.py:152: UserWarning: Glyph 32929 (\N{CJK UNIFIED IDEOGRAPH-80A1}) missing from current font.
  fig.canvas.print_figure(bytes_io, **kw)
/opt/hostedtoolcache/Python/3.8.16/x64/lib/python3.8/site-packages/IPython/core/pylabtools.py:152: UserWarning: Glyph 31080 (\N{CJK UNIFIED IDEOGRAPH-7968}) missing from current font.
  fig.canvas.print_figure(bytes_io, **kw)
/opt/hostedtoolcache/Python/3.8.16/x64/lib/python3.8/site-packages/IPython/core/pylabtools.py:152: UserWarning: Glyph 20195 (\N{CJK UNIFIED IDEOGRAPH-4EE3}) missing from current font.
  fig.canvas.print_figure(bytes_io, **kw)
/opt/hostedtoolcache/Python/3.8.16/x64/lib/python3.8/site-packages/IPython/core/pylabtools.py:152: UserWarning: Glyph 30721 (\N{CJK UNIFIED IDEOGRAPH-7801}) missing from current font.
  fig.canvas.print_figure(bytes_io, **kw)
/opt/hostedtoolcache/Python/3.8.16/x64/lib/python3.8/site-packages/IPython/core/pylabtools.py:152: UserWarning: Glyph 23425 (\N{CJK UNIFIED IDEOGRAPH-5B81}) missing from current font.
  fig.canvas.print_figure(bytes_io, **kw)
/opt/hostedtoolcache/Python/3.8.16/x64/lib/python3.8/site-packages/IPython/core/pylabtools.py:152: UserWarning: Glyph 27818 (\N{CJK UNIFIED IDEOGRAPH-6CAA}) missing from current font.
  fig.canvas.print_figure(bytes_io, **kw)
/opt/hostedtoolcache/Python/3.8.16/x64/lib/python3.8/site-packages/IPython/core/pylabtools.py:152: UserWarning: Glyph 39640 (\N{CJK UNIFIED IDEOGRAPH-9AD8}) missing from current font.
  fig.canvas.print_figure(bytes_io, **kw)
/opt/hostedtoolcache/Python/3.8.16/x64/lib/python3.8/site-packages/IPython/core/pylabtools.py:152: UserWarning: Glyph 36895 (\N{CJK UNIFIED IDEOGRAPH-901F}) missing from current font.
  fig.canvas.print_figure(bytes_io, **kw)
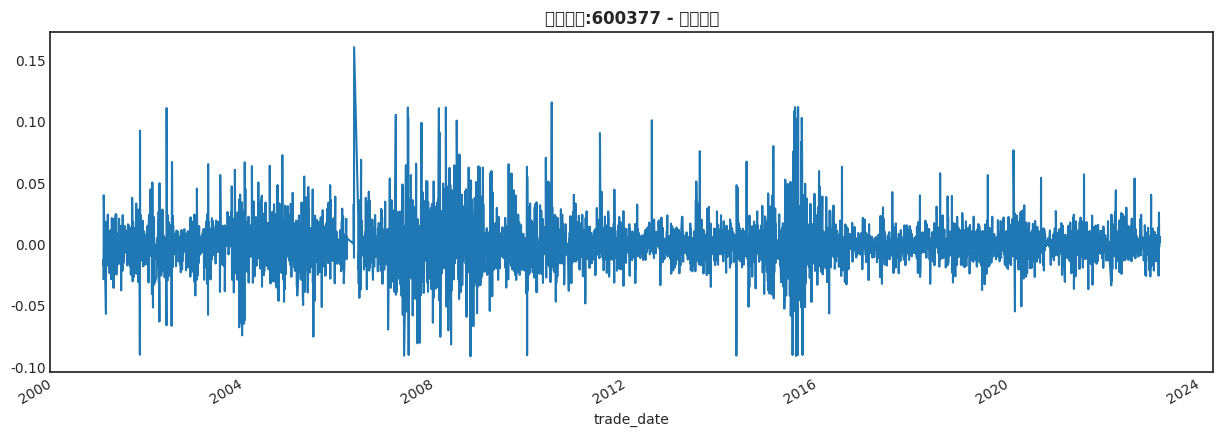
从上面可以看出,由于A股市场的每日涨跌幅限制,可以看到宁沪高速最大的涨跌幅为10%, 但其中有一个数据是超出10%(介于2016年至2017年坐标轴之间),估计是高开涨停。上图也可以理解为股票收益的波动图.
普通累计收益#
plt.figure(figsize=(15, 5))
rets_add_one = returns + 1
cumulative_rets = rets_add_one.cumprod()-1
cumulative_rets.plot()
<Axes: xlabel='trade_date'>
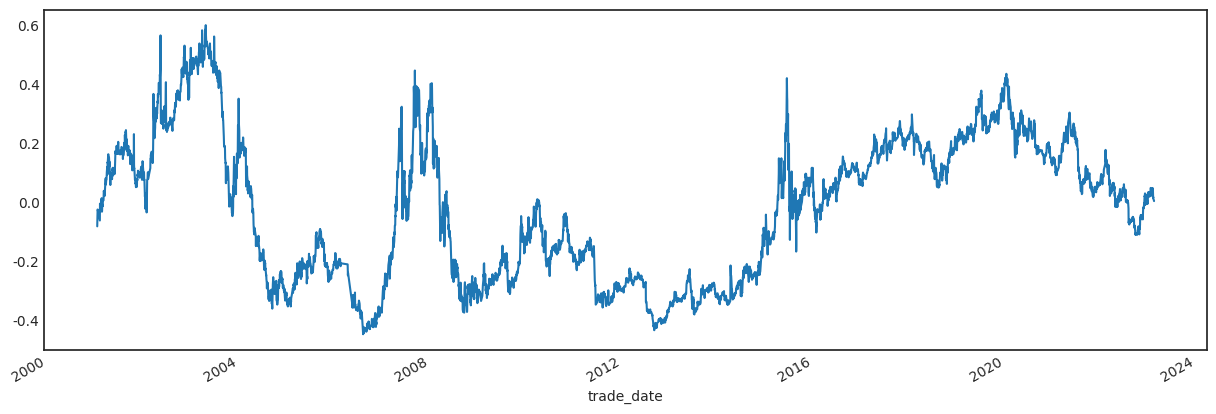
print('累计收益:',cumulative_rets[-1])
累计收益: -0.08054522924411345
对数累计收益(log returns)#
log_ret = np.log(returns+1)
cumulative_rets = log_ret.cumsum()
plt.figure(figsize=(15, 5))
plt.plot(cumulative_rets)
plt.show()
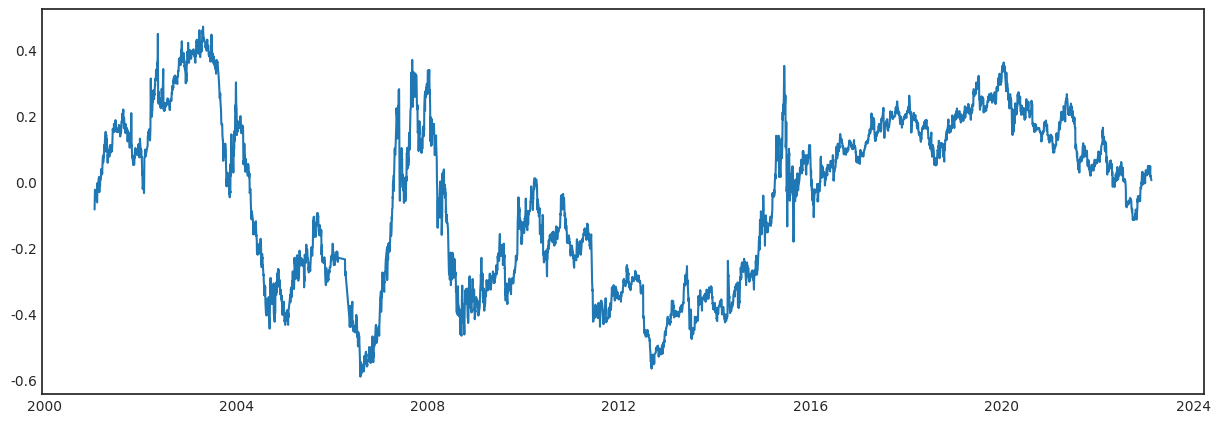
print('累计收益:',cumulative_rets[-1])
累计收益: -0.08397442510256933